Georgia Holds Tight as Undefeated Contenders Loom in Latest Playoff Projection
The road to the national championship became a bit clearer this week as the College Football Playoff Selection Committee released its third…
Markets, policy and the money behind both.

Vol. 2026
Independent · Daily
The road to the national championship became a bit clearer this week as the College Football Playoff Selection Committee released its third…
Chinese President Xi Jinping and Russian President Vladimir Putin gathered in the high tech hub of Shenzhen on Wednesday, presenting a united…
Asian stock markets largely trended downward on Wednesday as the fallout from a volatile session on Wall Street reached Eastern shores. The…
For a period this past summer, Pete Buttigieg found himself questioning whether he still had the stomach for public life. It was a low point triggered by a deeply personal ordeal involving a fraudulent report that brought Child Protective Services…
Israel has entered what many observers describe as the most pivotal election in its history, with millions of…
What began as a luxurious dream of permanent life at sea has turned into a logistical nightmare for…
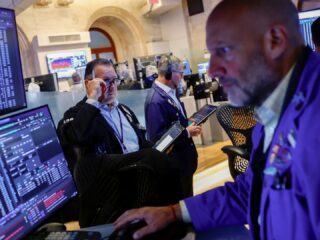
The financial landscape shifted dramatically this past week as a wave of panic selling swept through the artificial…
Nevada is seeing a significant uptick in political contributions from companies tied to the state’s booming data center…
The glitz and glamour of the Palladium Theatre in London provided a fitting backdrop for Harry Kane to…
Special report
Headlines move markets by the hour. A hundred years of the S&P 500 tells a calmer story: crashes happen, and patience has paid for every one of them.
Both losing decades held a crash and a recovery that came after the decade closed.
Peak-to-trough falls. Every one was recovered in full.
Average yearly return of the S&P 500, in percent.
$41,593 from $1 in 1920, before dividends
Log scale, so each gridline is ten times the one below.
Free. One email a weekday. Unsubscribe in one click.
This site is protected by reCAPTCHA and the Google Privacy Policy and Terms of Service apply.
Immersion Technologies LLC
The daily market brief lands every weekday morning. Enter your email and confirm it from your inbox.
This site is protected by reCAPTCHA and the Google Privacy Policy and Terms of Service apply.
Immersion Technologies LLC