Mike Rogers replacing Wray as FBI director is not happening, Trump adviser says
What Was the Highest Price for Gold? (Updated 2024)

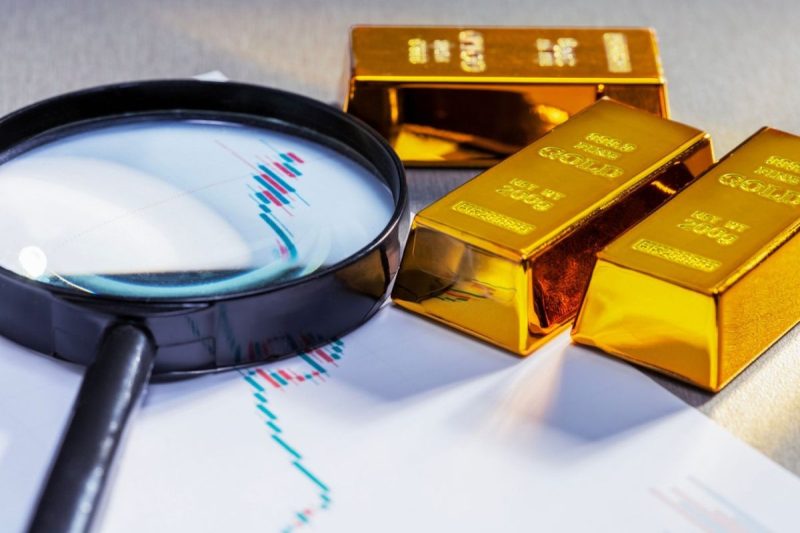
Gold has long been considered a store of wealth, and the gold price often makes its biggest gains during turbulent times as investors look for cover in this safe-haven asset.
The 21st century has so far been heavily marked by episodes of economic and sociopolitical upheaval. Uncertainty has pushed the precious metal to record highs as market participants seek its perceived security. And each time the gold price rises, there are calls for even higher record-breaking levels.
Gold market gurus from Lynette Zang to Chris Blasi to Jordan Roy-Byrne have shared eye-popping predictions on the gold price that would intrigue any investor — gold bug or not.
While some have posited that the gold price may break US$3,000 per ounce and carry on as high as US$4,000 or US$5,000, there are those with hopes that US$10,000 gold or even US$40,000 gold could become a reality.
These impressive price predictions have investors wondering, what is gold’s all time high? Gold has set 36 fresh all-time highs (ATH) in 2024 alone as of October 22, and we share the latest one and what has driven it to this level below. We also take a look at how the gold price has moved historically and what has driven its performance in recent years.
In this article:
How is gold traded?
Before discovering what the highest gold price ever was, it’s worth looking at how the precious metal is traded. Knowing the mechanics behind gold’s historical moves can help illuminate why and how its price changes.
Gold bullion is traded in dollars and cents per ounce, with activity taking place worldwide at all hours, resulting in a live price for the metal. Investors trade gold in major commodities markets such as New York, London, Tokyo and Hong Kong. London is seen as the center of physical precious metals trading, including for silver. The COMEX division of the New York Mercantile Exchange is home to most paper trading.
There are many popular ways to invest in gold. The first is through purchasing gold bullion products such as bullion bars, bullion coins and rounds. Physical gold is sold on the spot market, meaning that buyers pay a specific price per ounce for the metal and then have it delivered. In some parts of the world, such as India, buying gold in the form of jewelry is the largest and most traditional route to investing in gold.
Another path to gold investment is paper trading, which is done through the gold futures market. Participants enter into gold futures contracts for the delivery of gold in the future at an agreed-upon price. In such contracts, two positions can be taken: a long position under which delivery of the metal is accepted or a short position to provide delivery of the metal. Paper trading as a means to invest in gold can provide investors with the flexibility to liquidate assets that aren’t available to those who possess physical gold bullion.
One significant long-term advantage of trading in the paper market is that investors can benefit from gold’s safe-haven status without needing to store it. Furthermore, gold futures trading can offer more financial leverage in that it requires less capital than trading in the physical market.
Interestingly, investors can also purchase physical gold via the futures market, but the process is complicated and lengthy and comes with a large investment and additional costs.
Aside from those options, market participants can invest in gold through exchange-traded funds (ETFs). Investing in a gold ETF is similar to trading a gold stock on an exchange, and there are numerous gold ETF options to choose from. For instance, some ETFs focus solely on physical gold bullion, while others focus on gold futures contracts. Other gold ETFs center on gold-mining stocks or follow the gold spot price.
It is important to understand that you will not own any physical gold when investing in an ETF — in general, even a gold ETF that tracks physical gold cannot be redeemed for tangible metal.
With regards to the performance of gold versus trading stocks, gold has an interesting relationship with the stock market. The two often move in sync during “risk-on periods” when investors are bullish. On the flip side, they tend to become inversely correlated in times of volatility.
According to the World Gold Council, gold’s ability to decouple from the stock market during periods of stress makes it “unique amongst most hedges in the marketplace.” It is often during these times that gold outperforms the stock market. For that reason, it is often used as a portfolio diversifier to hedge against uncertainty.
What was the highest gold price ever?
The gold price rose to US$2,757.40, its all-time highest price, on October 23, 2024. What drove it to set this new ATH?
The 36th gold price high this year was hit as the Chinese central bank cut interest rates as it works to stimulate its slowing economy, and conflict escalated in the Middle East. The previous week, the European Central Bank also cut rates to stimulate growth as the EU’s economy slows as well. Uncertainty around the US presidential election in November is also driving gold.
On October 15, the International Monetary Fund announced that global debt is expected to hit US$100 trillion in 2024, led by the US and China. The non-partisan US Committee for a Responsible Federal Budget reported that candidates Kamala Harris and Donald Trump could raise the debt by a central estimate of US$3.5 trillion and US$7.5 trillion, respectively, by 2035. The high estimates for the candidates were US$8.1 trillion and US$15.15 trillion.
Read our in-depth breakdown of gold’s recent price performance below.
2024 gold price chart
2024 gold price chart. December 31, 2023, to October 23, 2024.
What factors have driven the gold price in the last five years?
Despite these recent runs, gold has seen its share of both peaks and troughs over the last decade. After remaining rangebound between US$1,100 and US$1,300 from 2014 to early 2019, gold pushed above US$1,500 in the second half of 2019 on a softer US dollar, rising geopolitical issues and a slowdown in economic growth.
Gold’s first breach of the significant US$2,000 price level in mid-2020 was due in large part to economic uncertainty caused by the COVID-19 pandemic. To break through that barrier and reach what was then a record high, the yellow metal added more than US$500, or 32 percent, to its value in the first eight months of 2020.
The gold price surpassed that level again in early 2022 as Russia’s invasion of Ukraine collided with rising inflation around the world, increasing the allure of safe-haven assets and pulling the yellow metal up to a price of US$2,074.60 on March 8, 2022. However, it fell throughout the rest of 2022, dropping below US$1,650 in October.
5 year gold price chart. October 22, 2019, to October 23, 2024.
Although it didn’t quite reach the level of volatility as the previous year, the gold price experienced drastic price changes in 2023 on the back of banking instability, high interest rates and the breakout of war in the Middle East.
After central bank buying pushed the gold price up to the US$1,950.17 mark by the end of January, the US Federal Reserve’s 0.25 percent rate hike on February 1 sparked a retreat as the dollar and Treasury yields saw gains. The precious metal went on to fall to its lowest price level of the year at US$1,809.87 on February 23.
The banking crisis that hit the US in early March caused a domino effect through the global financial system and led to the mid-March collapse of Credit Suisse, Switzerland’s second-largest bank. The gold price jumped to US$1,989.13 by March 15. The continued fallout in the global banking system throughout the second quarter of the year allowed gold to break above US$2,000 on April 3, and go on to flirt with a near-record high of US$2,049.92 on May 3.
Those gains were tempered by the Fed’s ongoing rate hikes and improvements in the banking sector, resulting in a downward trend in the gold price throughout the remainder of the second quarter and throughout the third quarter. By October 4, gold had fallen to a low of US$1,820.01 and analysts expected the precious metal to be on the path to drop below the US$1,800 level.
That was before the October 7 attacks by Hamas on Israel ignited legitimate fears of a much larger conflict erupting in the Middle East. Reacting to those fears, and rising expectations that the US Federal Reserve would begin to reverse course on interest rates, gold broke through the important psychological level of US$2,000 per ounce and closed at US$2,007.08 on October 27. As the Israel-Hamas fighting intensified, gold reached a then new high of US$2,152.30 during intraday trading on December 3.
That robust momentum in the spot gold price has continued into 2024, chasing new highs on fears of a looming US recession, the promise of Fed rate cuts on the horizon, the worsening conflict in the Middle East and the tumultuous US presidential election year. By mid-March, gold was pushing up against the US$2,200 level.
That record-setting momentum continued into the second quarter of 2024 when gold broke through US$2,400 per ounce in mid-April on strong central bank buying, sovereign debt concerns in China and investors expecting the Fed to start cutting interest rates. The precious metal went on to hit US$2,450.05 per ounce on May 20.
Throughout the summer, the hits have just kept on coming. The global macro environment is highly bullish for gold in the lead up to the US election. Following the failed assassination attempt on former US President Donald Trump and a statement about coming interest rate cuts by Fed Chair Jerome Powell, the gold spot price hit a new all-time high on July 16 at US$2,469.30 per ounce.
One week later, news that President Joe Biden would not seek re-election and would instead pass the baton to his VP Kamala Harris eased some of the tension in the stock markets and strengthened the US dollar. This also pushed the price of gold down to US$2,387.99 per ounce on July 22.
However, the bullish factors supporting gold over the past year remain in play and the spot price for gold has gone on to breach the US$2,500 level first on August 2 on a less than stellar US jobs report before closing just above the US$2,440 level. A few weeks later, gold pushed past US$2,500 once again on August 16, to close above that level for the first time ever after the US Department of Commerce released data showing a fifth consecutive monthly decrease in a row for homebuilding.
The news that the Chinese government issued new gold import quotas to banks in the country following a two month pause also helped fuel the gold price rally. Central bank gold buying has been a significant tailwind for the gold price this year, and China’s central bank has been one of the strongest buyers.
Market watchers expected the Fed to cut interest rates by a quarter point at their September meeting, but news on September 12 that the regulators were still deciding between the expected cut or a larger half-point cut led gold prices on a rally that carried through into the next day, bringing gold prices near US$2,600.
At the September 18 Fed meeting, the committee ultimately made the decision to cut rates by half a point, news that sent gold even higher. By Friday, September 20, it moved above US$2,600 and held above US$2,620.
In October, gold breached the US$2,700 level and has continued to set new highs on a variety of factors, including further rate cuts and economic data anticipation, the escalating conflict in the Middle East between Israel and Hezbollah, and economic stimulus in China — not to mention the very close race between the US presidential candidates as we move closer to the November 5 election date.
What’s next for the gold price?
What’s next for the gold price is never an easy call to make. There are many factors that affect the gold price, but some of the most prevalent long-term drivers include economic expansion, market risk, opportunity cost and momentum.
Economic expansion is one of the primary gold price contributors as it facilitates demand growth in several categories, including jewelry, technology and investment. As the World Gold Council explains, “This is particularly true in developing economies where gold is often used as a luxury item and a means to preserve wealth.” Market risk is also a prime catalyst for gold values as investors view the precious metal as the “ultimate safe haven,” and a hedge against currency depreciation, inflation and other systemic risks.
Going forward, in addition to the Fed, inflation and geopolitical events, experts will be looking for cues from factors like supply and demand. In terms of supply, the world’s five top gold producers are China, Australia, Russia, Canada and the US. The consensus in the gold market is that major miners have not spent enough on gold exploration in recent years. Gold mine production has fallen from around 3,200 to 3,300 metric tons each year between 2018 and 2020 to around 3,000 to 3,100 metric tons each year between 2021 and 2023.
On the demand side, China and India are the biggest buyers of physical gold, and are in a perpetual fight for the title of world’s largest gold consumer. That said, it’s worth noting that the last few years have brought a big rebound in central bank gold buying, which dropped to a record low in 2020, but reached a 55 year high of 1,136 metric tons in 2022.
The World Gold Council has reported that central bank gold purchases in 2023 came to 1,037 metric tons, marking the second year in a row above 1,000 MT. In the first half of 2024, the organization says gold purchases from central banks reached a record 483 metric tons.
David Barrett, CEO of the UK division of global brokerage firm EBC Financial Group, is also keeping an eye on central bank purchases of gold.
In addition to central bank moves, analysts are also watching for escalating tensions in the Middle East, a weakening US dollar, declining bond yields, and further interest rate cuts as factors that could push gold higher as investors look to secure their portfolios.
Speaking at the Metals Investor Forum, held in Vancouver, British Columbia, this September, Eric Coffin, editor of Hard Rock Analyst, outlined those key factors as supporting his prediction that gold could reach US$2,800 by the end of 2024.
“When it comes to outside factors that affect the market, it’s just tailwind after tailwind after tailwind. So I don’t really see the trend changing,” Coffin said.
Also speaking at the Metals Investor Forum, Jeff Clark, founder and editor at TheGoldAdvisor.com, was even more bullish on the precious metal. He sees Santa delivering US$3,000 gold as a good possibility.
However, others see gold taking a little longer to breach the US$3,000 level. Delegates at the London Bullion Market Association’s annual gathering in October have forecasted a gold price of US$2,941 in the next 12 months.
Meanwhile, Goldman Sachs (NYSE:GS) is predicting gold will hit US$2,900 in early 2025, as it expects to see an increase in gold ETF inflows, continued central bank buying and interest rate cuts, as well as further conflicts in the Middle East.
Should you beware of gold price manipulation?
As a final note on the price of gold and buying gold bullion, it’s important for investors to be aware that gold price manipulation is a hot topic in the industry.
In 2011, when gold hit what was then a record high, it dropped swiftly in just a few short years. This decline after three years of impressive gains led many in the gold sector to cry foul and point to manipulation. Early in 2015, 10 banks were hit in a US probe on precious metals manipulation. Evidence provided by Deutsche Bank (NYSE:DB) showed “smoking gun” proof that UBS Group (NYSE:UBS), HSBC Holdings (NYSE:HSBC), the Bank of Nova Scotia (NYSE:BNS) and other firms were involved in rigging gold and silver rates in the market from 2007 to 2013.
Not long after, the long-running London gold fix was replaced by the LBMA gold price in a bid to increase gold price transparency. The twice-a-day process, operated by the ICE Benchmark Administration, still involves a variety of banks collaborating to set the gold price, but the system is now electronic.
Still, manipulation has by no means been eradicated, as a 2020 fine on JPMorgan (NYSE:JPM) shows. The next year, chat logs were released in a spoofing trial for two former precious metals traders from the Bank of America’s (NYSE:BAC) Merrill Lynch unit. They show a trader bragging about how easy it is to manipulate the gold price.
Gold market participants have consistently spoken out about manipulation. In mid-2020, Chris Marcus, founder of Arcadia Economics and author of the book “The Big Silver Short,” said that when gold fell back below the US$2,000 mark after hitting close to US$2,070, he saw similarities to what happened with the gold price in 2011.
Marcus has been following the gold and silver markets with a focus specifically on price manipulation for nearly a decade. His advice? “Trust your gut. I believe we’re witnessing the ultimate ’emperor’s really naked’ moment. This isn’t complex financial analysis. Sometimes I think of it as the greatest hypnotic thought experiment in history.”
Investor takeaway
While we have the answer to what the highest gold price ever is as of now, it remains to be seen how high gold can climb, and if the precious metal can reach as high as US$5,000, US$10,000 or even US$40,000.
Even so, many market participants believe gold is a must have in any investment profile, and there is little doubt investors will continue to see gold price action making headlines this year and beyond.
Securities Disclosure: I, Melissa Pistilli, hold no direct investment interest in any company mentioned in this article.


