Pepsi kills the bottle that was supposed to beat Mexican Coke
Gold silver ratio at 70: what it signals after the 2026…

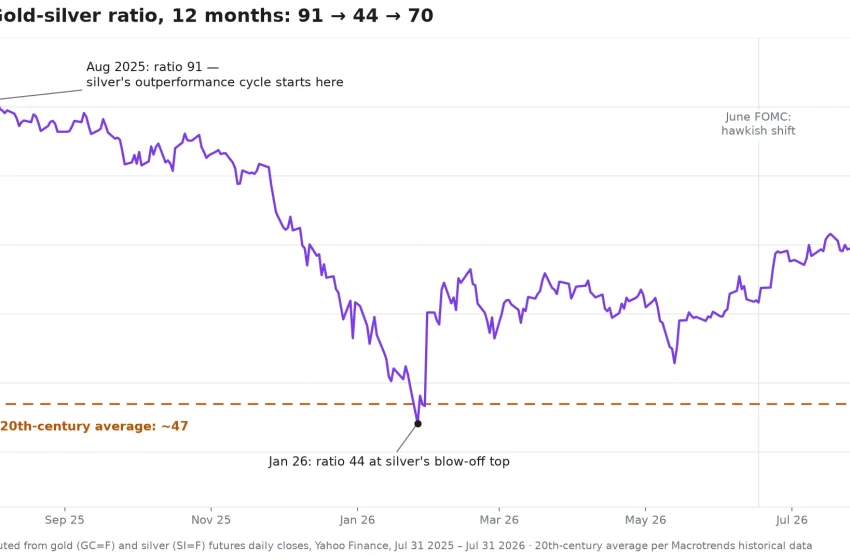
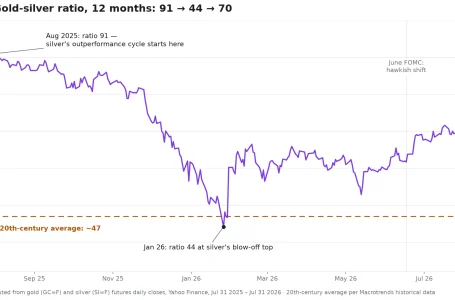
The most quoted number in precious metals right now is also the most misread. The gold silver ratio — how many ounces of silver one ounce of gold buys — sits near 70:1 after the 2026 metals crash, and the commentary treats that as an extreme signalling an automatic silver rebound. The 12-month tape says something more uncomfortable: the ratio was 91 last August, collapsed to 44 at silver’s January blow-off top, and has now merely retraced to 70. Anyone who bought the “extreme ratio” at 91 was early by five months and then right by 150%; anyone who bought silver at 44 because the ratio was “historically low for silver” caught a 52% drawdown. The ratio is a valuation anchor, not a timing tool — and right now it is pricing a specific macro view you should understand before trading against it.
What the 70:1 reading actually encodes is the demand split this desk has documented across both metals’ consolidated forecasts: gold has a rate-insensitive buyer — central banks, led by a People’s Bank of China on a 20-month buying streak — while 58% of silver demand is rate-sensitive industry, per the Silver Institute’s World Silver Survey 2026. When the hawkish Federal Reserve cut its 2026 rate-cut projection from two to one, the same policy shock cost silver 52% from its January record but gold only 28% from its own. The ratio at 70 is not an anomaly to be arbitraged; it is the market’s price on the gap between a monetary metal and an industrial one in a higher-for-longer world.
Key facts
- Gold silver ratio: ~70.5:1 on July 31, 2026 (gold futures $4,114 ÷ silver futures $58.33) — computed from Yahoo Finance daily closes
- 12-month range: 91 (August 1, 2025) down to 44.1 (January 26, 2026, silver’s blow-off top) and back to 70.5
- Historical anchors: the ratio was fixed at 15:1 by the US Coinage Act of 1792, averaged roughly 47:1 across the 20th century, and hit its all-time high near 125:1 in March 2020 — Macrotrends 100-year data
- The demand split behind the ratio: 58% of silver demand is industrial (Silver Institute World Silver Survey 2026); gold’s marginal bid is central banks at ~1,000 tonnes/year, with the PBOC on a 20-month streak — GoldSilver
- Street context: silver targets run $60–110 (JPMorgan to Citigroup) and gold $4,400–5,200 — most bank pairs imply a year-end ratio in the mid-60s to low-70s, i.e. no dramatic mean reversion
- July 29 FOMC: rates held 9–3 with all three dissents wanting a hike — the policy backdrop the ratio is pricing, per FinanceFeeds’ FOMC coverage
What the gold silver ratio is — and what it is not
The gold silver ratio is simply the gold price divided by the silver price: at $4,114 gold and $58.33 silver, one ounce of gold buys 70.5 ounces of silver. Traders use it as a relative-value gauge between the two metals — a high ratio means silver is cheap relative to gold, a low ratio means silver is expensive relative to gold. It is the oldest valuation metric in monetary history: the US Coinage Act of 1792 fixed it at 15:1 by law, reflecting the metals’ rough supply relationship in the ground. The free-market era broke that anchor permanently. Across the 20th century the ratio averaged about 47:1; in the 21st it has lived mostly between 50 and 90, spiking to an all-time record near 125:1 in the March 2020 panic and bottoming near 30:1 in 2011’s silver mania.
What it is not is a mean-reverting spring with a known resting point. The “mean” depends entirely on the window you choose — 15 by law, 47 by the last century, about 68 by the last decade — and the ratio has spent entire decades on one side of every one of those averages. The metric’s genuine use is narrower and more valuable: it tells you which macro regime the metals market is pricing, and it defines the relative-value trade for investors who want metals exposure without a directional price bet.
The 12-month round trip: what 91 → 44 → 70 actually taught
Last August the ratio stood at 91 — deep in the zone that ratio traditionalists call a screaming silver buy. They were eventually right: silver ran from $36 to a $121.62 spot record by January 29, compressing the ratio to 44, its lowest reading since 2011’s aftermath. But the compression was not driven by the ratio “correcting”; it was driven by a leveraged momentum melt-up in silver that overshot every fundamental framework, as this desk documented in the consolidated silver forecast. When the hawkish Fed shock arrived, the unwind re-expanded the ratio from 44 to 70 in six months — silver gave back its entire relative outperformance while gold found a floor at the World Gold Council’s fair-value band.
The lesson is the sequencing. The ratio at 91 was “right” that silver was cheap — but the catalyst that closed the gap was a positioning mania, not the ratio itself, and the give-back was just as violent. A ratio extreme identifies asymmetry; it says nothing about path. Anyone using it as a standalone timing signal in the past twelve months was whipsawed twice in opposite directions.
Why the ratio blew back out: two buyers, one Fed
The re-expansion from 44 to 70 has a precise mechanical explanation. Gold’s marginal buyer in 2026 is a central bank: the People’s Bank of China added 14.93 tonnes in June alone — its 20th consecutive monthly purchase — and China is buying every gold dip as part of a reserve-diversification programme that does not read the Fed’s dot plot. Silver has no such buyer. Its demand base is 58% industrial — solar, semiconductors, EV components — and every leg of it is rate-sensitive. UBS strategists Wayne Gordon and Dominic Schnider put the imbalance plainly when they cut their silver outlook in May: “For 2026, we expect weaker demand from photovoltaics due to elevated prices; higher prices are also weighing on silverware and jewelry demand.” Their gold view, in the same note: “We still expect gold prices to trend higher, providing an important anchor for silver,” per Kitco.
That pair of sentences is the ratio trade in miniature: the anchor metal holds, the industrial metal floats with the growth outlook, and the spread between them is Fed policy. It is why the June FOMC’s projection cut — two 2026 cuts to one — shows up on the ratio chart as the start of the final leg from the low 60s to 70, and why the July 29 hold, with three dissents wanting a hike, has kept it pinned there.
China adds a structural layer to the divergence that predates this cycle and will outlast it. Beijing’s July paper-gold trading ban pushed speculative flow out of Shanghai’s derivatives market while the physical premium settled at an orderly $3–6 — evidence that the state’s gold programme absorbs supply without stress even in a falling market. There is no silver equivalent of that programme anywhere in the official sector. Every tonne of central-bank accumulation widens the structural floor under one side of the ratio and leaves the other side to the business cycle, which is why the post-2022 era’s ratio range has sat visibly higher than the 20th-century average: the official sector permanently owns part of gold’s demand curve now, and it owns none of silver’s.
How traders actually use the ratio
The classic playbook is the switching rule — often quoted as the “80/50 rule”: accumulate silver with your metals allocation when the ratio is above 80 (silver historically cheap), rotate into gold when it falls below 50 (silver historically rich), and do nothing in between. Executed mechanically over the past year it worked almost perfectly: it had you in silver at 91 last August and rotating into gold as the ratio broke below 50 in January — days before silver’s top. That is better than most professional timing, and it is worth being honest that this was partly luck: the rule’s edge comes from patience across multi-year cycles, not from precision.
Institutional desks trade the ratio as a relative-value pair — long one metal, short the other, sized to be price-neutral — which isolates the spread from the direction of metals overall. Retail investors can approximate the same idea more simply: the ratio at 70 argues for new precious-metals allocations to lean silver-heavy relative to a neutral split, on the view that the next Fed easing cycle compresses the ratio, while keeping gold as the core holding precisely because its central-bank bid is the part of the market that cannot be squeezed by the dot plot. What the ratio does not support at 70 is an aggressive all-in silver rotation: 70 is elevated against the 20th-century average of 47, but it is only the middle of the past decade’s 50–90 range — and it was 21 points higher just twelve months ago.
Where the ratio goes from here
Take the street’s own year-end targets and the ratio maths falls out mechanically. JPMorgan’s bearish pair — $4,500 gold, $60–65 silver — implies a ratio near 70–75: no reversion. The mid-street pair — UBS’s $80 silver against Goldman’s $4,900 gold — implies about 61. Citigroup’s $110 silver against $4,800–5,200 gold implies the low-to-mid 40s: full reversion, but only in the scenario where a dovish Fed pivot reignites silver’s investment demand. In other words, the entire dispersion in bank ratio forecasts is one variable: how many cuts the Fed delivers and when. A decisive break of the ratio back under 65 would be the earliest tape confirmation that the monetary bid is broadening from gold into silver — the trigger flagged in both of this desk’s metal forecasts. A push toward 80 would say the growth channel is deteriorating faster than the Fed is easing, which historically has been the ratio’s ugliest regime for silver holders.
One caveat belongs on the record before the FAQ. Every ratio figure in this piece is computed from front-month futures closes, which can differ from spot-based calculators by a point or so depending on roll timing — the bullion-dealer charts that dominate search results for this term typically use spot. The regime conclusions are identical on either basis; only the second decimal moves. And because the ratio is a quotient of two volatile series, single-day readings are noise: the June FOMC regime break is visible as a multi-week shelf on the chart, not a one-day spike, and that is the resolution at which the metric deserves to be read.
FAQ
What is the gold silver ratio right now?
About 70.5:1 as of July 31, 2026 — gold futures at $4,114 divided by silver futures at $58.33. Twelve months ago it was 91; at silver’s January record it touched 44. The current reading sits above the 20th-century average of ~47 but in the middle of the past decade’s 50–90 range.
What is a good gold to silver ratio to buy silver?
There is no magic number, but the common framework treats readings above 80 as historically cheap silver and below 50 as historically rich. At 70, silver is inexpensive relative to gold but not at an extreme — the stronger version of the buy case rests on the Fed easing, not on the ratio alone.
What is the 80/50 rule for gold and silver?
A mechanical switching strategy: hold silver when the ratio is above 80, rotate into gold when it drops below 50, and hold your existing position in between. Over the past year it would have bought silver at 91 and rotated to gold near silver’s January top — an unusually good outcome for a rule whose real edge is patience over cycles, not precision.
Why did the gold silver ratio rise in 2026?
Because the two metals have different buyers. The hawkish Fed (one projected 2026 cut, three July dissents wanting a hike) crushed silver’s rate-sensitive industrial demand — 58% of its market — while central banks kept buying gold regardless. Silver fell 52% from its record, gold 28%, and the ratio re-expanded from 44 to 70.
Could silver hit $1,000 an ounce?
Not on any framework a major institution publishes. The most bullish street target is Citigroup’s $110, and silver’s own January record was $121.62. A $1,000 silver price at today’s gold price would imply a ratio of 4:1 — far below even the 15:1 of the 1792 Coinage Act. Treat such claims as engagement content, not analysis.
Is the ratio signalling a silver buy after the crash?
It is signalling asymmetry, not timing. At 70, silver is cheap relative to gold, and every bank’s silver target sits above spot — but the catalyst that compresses the ratio is Federal Reserve easing, and three FOMC members just voted to hike. Our consolidated silver and gold forecasts carry the full bull, bear and invalidation levels.
This article is informational analysis only and is not financial or investment advice. Commodity prices are volatile and can lose substantial value rapidly. Past performance and historical patterns do not guarantee future results. Do your own research and consult a regulated financial adviser before making any investment decision.